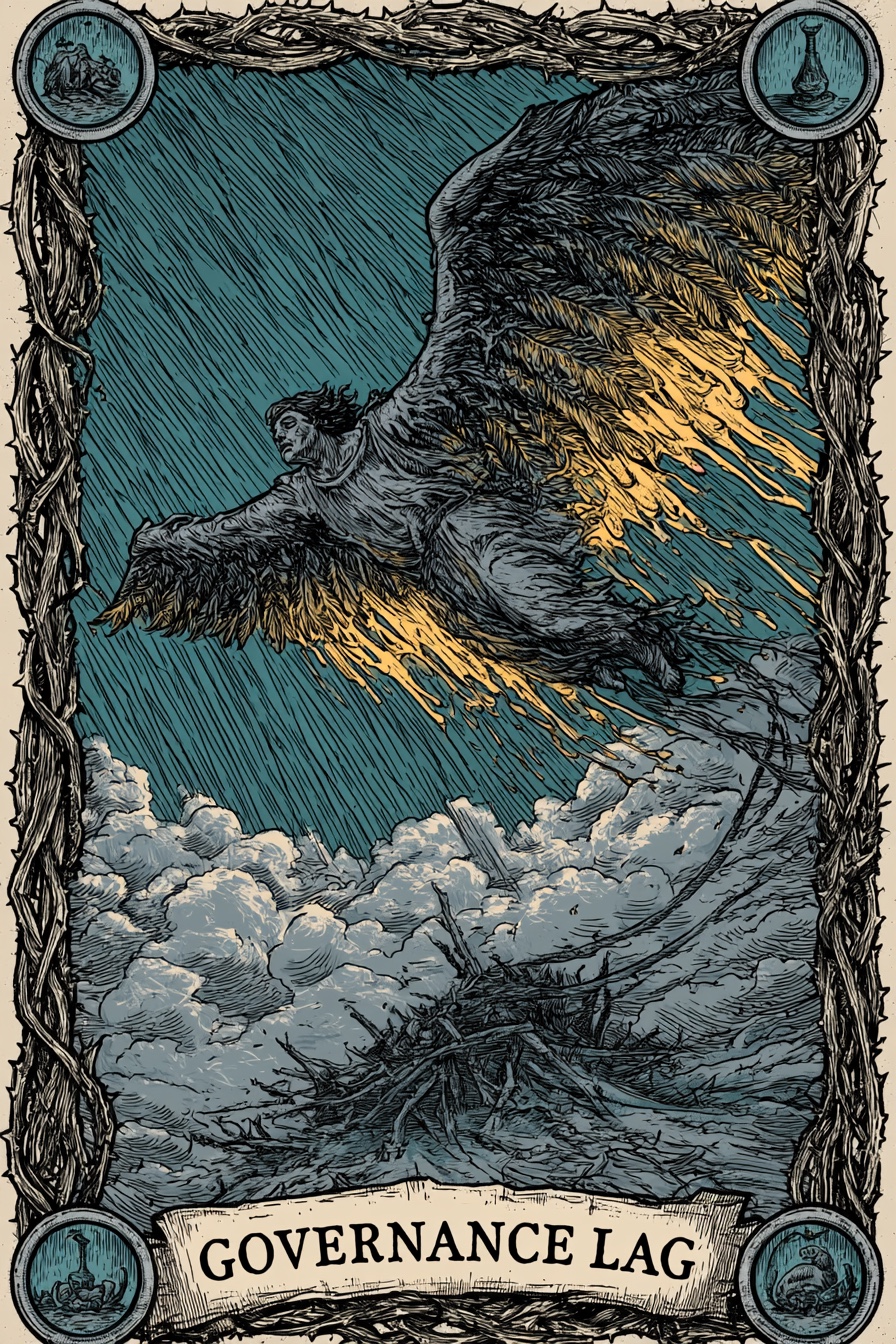
Governance Lag
What does this mean?
Revenue and Program Scale spike rapidly, but the Governance Score remains stagnant. The organization has outgrown its founding era but hasn't installed proper oversight.
The Path Forward
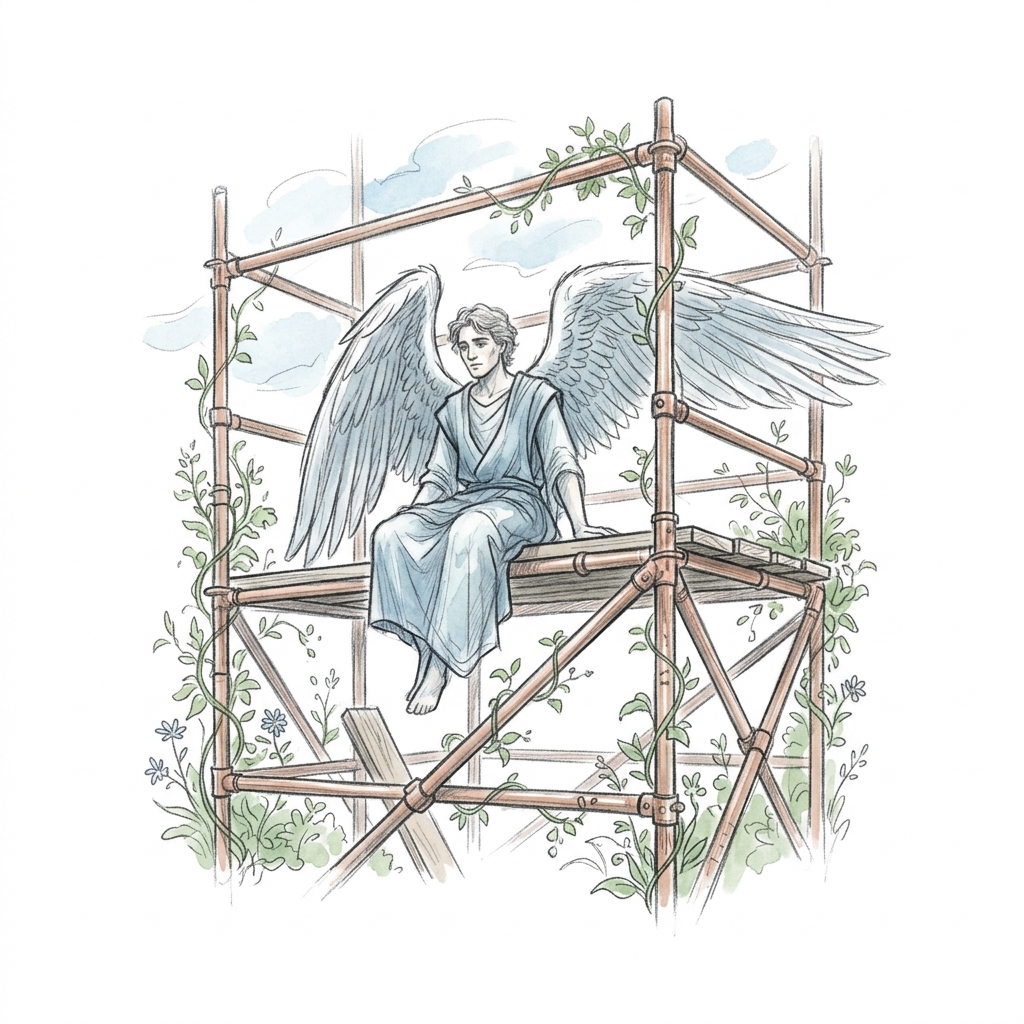
The Scaffold
Brings immediate structural maturity. It represents the necessity of outside, independent oversight to manage new scale, breaking the echo chamber of a founding 'friends and family' board.
Title
Representative Institutions
Institutional Epochs
Historical Performance
| Year | Revenue | Top Comp | Comp % Rev | Score | Phase Label | Outlook | Details |
|---|---|---|---|---|---|---|---|
| 2025 | Hidden | Hidden | — | — | Unknown | — | |
| 2024 | Hidden | Hidden | — | 56 | Fragile | Recovery | |
| 2023 | — | — | — | 49 | Fragile | Recovery | |
| 2022 | — | — | — | 34 | Critical Intervention Needed | Recovery | |
| 2021 | — | — | — | 31 | Critical Intervention Needed | Decline Risk | |
| 2016 | — | — | — | 33 | Critical Intervention Needed | Recovery | |
| 2014 | — | — | — | 25 | Critical Intervention Needed | Decline Risk | |
| 2013 | — | — | — | 33 | Critical Intervention Needed | Recovery | |
| 2012 | — | — | — | 29 | Critical Intervention Needed | Stable Watch |
Officer compensation history
Tax year 2025
| Name | Title | Phone | Compensation | |
|---|---|---|---|---|
| Jeffrey Frisch | Executive Director | — | ||
| Robin Repp | Secretary | — | ||
| Tom Lamb | Board Member | — | ||
| Donnal Pope | Treasurer | — | ||
| Debra Vodhanel | Board Member | — |
Tax year 2023
| Name | Title | Phone | Compensation | |
|---|---|---|---|---|
| Jeffrey Frisch | Executive Director | — | ||
| Robin Repp | Secretary | — | ||
| Evalyn Alu | Board Member | — | ||
| Annie Clavel | Treasurer | — |
Tax year 2022
| Name | Title | Phone | Compensation | |
|---|---|---|---|---|
| Jeffrey Frisch | Executive Director | — | ||
| Robin Repp | Secretary | — | ||
| Evalyn Alu | Board Member | — | ||
| Sohelia Siadate | Treasurer | — |
Score breakdown
The three components combine into a single 0–100 score weighted as shown. Full methodology →
Peer comparison
Compared to 333 other orgs in CA with NTEE prefix A5.
Most-divergent component: governance score sits 31 points below the peer median (50 vs. 81).
5-year trend: Governance Lag
Revenue and Program Scale spike rapidly, but the Governance Score remains stagnant. The organization has outgrown its founding era but hasn't installed proper oversight.
What's driving this score
- All-volunteer org with no paid officers — governance signal is neutral (default 50), not absent.
- Net assets declined for 3 consecutive years of deficit spending; cash runway narrowing.
What would change this score
The two changes that would most improve this score:
- Stabilize program expenses or grow earned-income revenue to break the consecutive-deficit pattern (~8 points to financial score).
Improving governance is a board decision. These are the levers.