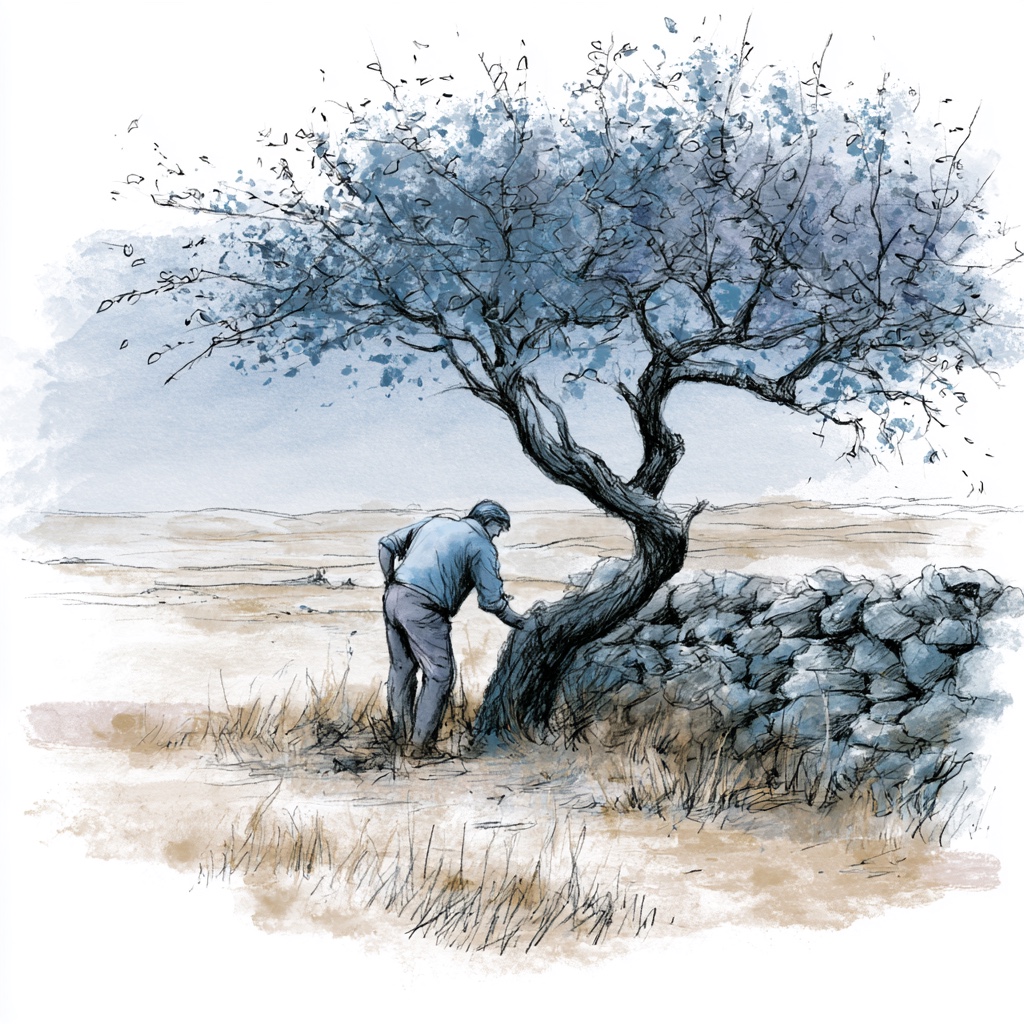
Steady State
What does this mean?
No extreme longitudinal divergence detected. The organization is maintaining its current operational philosophy.
The Path Forward
The Stewardship
Focuses on long-term sustainability and gentle cultivation of existing resources rather than forced expansion. It honors the organization's established role as a reliable anchor.

Title
Representative Institutions
Institutional Epochs
Historical Performance
| Year | Revenue | Top Comp | Comp % Rev | Score | Phase Label | Outlook | Details |
|---|---|---|---|---|---|---|---|
| 2025 | Hidden | Hidden | — | — | Unknown | — | |
| 2024 | Hidden | Hidden | — | — | Unknown | — | |
| 2023 | — | — | 9.8% | 53 | Fragile | Recovery | |
| 2022 | — | — | 24.9% | 46 | Fragile | Recovery | |
| 2021 | — | — | — | 41 | Fragile | Recovery | |
| 2020 | — | — | 25.6% | 42 | Fragile | Gov Risk |
Officer compensation history
Tax year 2026
| Name | Title | Phone | Compensation | |
|---|---|---|---|---|
| Leslie Putnam | Executive Director | — | ||
| Sonja Putnam | Treasurer | — | ||
| Bethany Rowe | Board President | — | ||
| Amy Carlson | Secretary | — |
Tax year 2025
| Name | Title | Phone | Compensation | |
|---|---|---|---|---|
| Leslie Putnam | Executive Director | 9.8% of Rev | ||
| Sonja Putnam | Treasurer | — | ||
| Bethany Rowe | Board President | — | ||
| Amy Carlson | Secretary | — |
Tax year 2023
| Name | Title | Phone | Compensation | |
|---|---|---|---|---|
| Leslie Putnam | Teaching Artist | 12.2% of Rev | ||
| Bethany Rowe | Board President | — | ||
| Amy Carlson | Secretary | — | ||
| Sonja Putnam | Treasurer | — | ||
| Leslie Putnam | Executive Director | — |
Tax year 2022
| Name | Title | Phone | Compensation | |
|---|---|---|---|---|
| Leslie Putnam | Teaching Artist | 10.7% of Rev | ||
| Emily McCurry | Board President | — | ||
| Amanda Farooqi | Secretary | — | ||
| Travis Lane | Treasurer | — | ||
| Leslie Putnam | Executive Director | — |
Score breakdown
The three components combine into a single 0–100 score weighted as shown. Full methodology →
Peer comparison
Compared to 222 other orgs in NC with NTEE prefix A6.
Most-divergent component: financial score sits 13 points above the peer median (65 vs. 52).
5-year trend: Steady State
No extreme longitudinal divergence detected. The organization is maintaining its current operational philosophy.
What's driving this score
- Comp-to-revenue ratio of 9.8% sits within the sector's healthy band (18–22%).
- Two consecutive years of deficit spending.
What would change this score
The two changes that would most improve this score:
- Stabilize program expenses or grow earned-income revenue to break the consecutive-deficit pattern (~8 points to financial score).
Improving governance is a board decision. These are the levers.