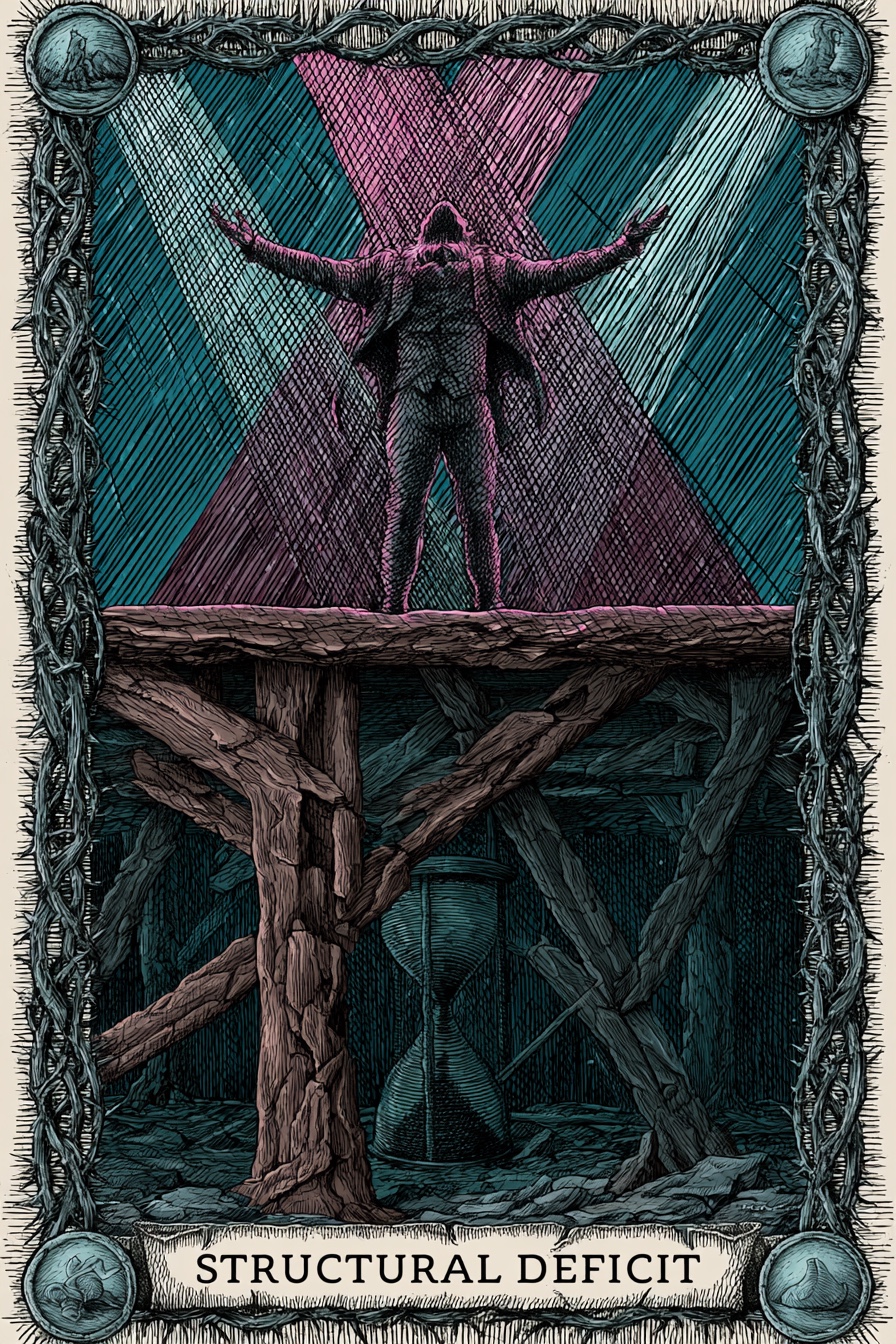
Structural Deficit
"Preserves and promotes Appalachian cultural arts and the historic Stecoah community school building, offering diverse programs to save fading mountain culture and enrich lives through economic incentives and community engagement."
— Statement of Program Service Accomplishments
What does this mean?
Persistently low financial health over 5 years despite strong programmatic output. They are borrowing from their future (or bleeding an endowment) to pay for today's programs.
The Path Forward
The Truth-Teller
Forces necessary, painful cuts to preserve the core. It demands that the organization stop borrowing from its future and align its current programmatic output with actual sustainable revenue.
Demonstrated Impact
- Approx 2300 audience for 'Appalachian Evening'
- Over 180 artists supported by gallery
- 4900 audience members for gallery/drive about
- Approx 3000 attendees at Annual Harvest Festival
- Approx 50 participants through 10 classes
- Over 15,000 people visit buildings and grounds annually
Title
Representative Institutions
Institutional Epochs
Historical Performance
| Year | Revenue | Top Comp | Comp % Rev | Score | Phase Label | Outlook | Details |
|---|---|---|---|---|---|---|---|
| 2025 | Hidden | Hidden | — | — | Unknown | — | |
| 2023 | Hidden | Hidden | 12.6% | 33 | Critical Intervention Needed | Decline Risk | |
| 2022 | — | — | 10.3% | 37 | Fragile | Recovery | |
| 2021 | — | — | 21.5% | 39 | Fragile | Recovery | |
| 2020 | — | — | 8.3% | 32 | Critical Intervention Needed | Decline Risk | |
| 2019 | — | — | 9.9% | 36 | Financially Distressed | Recovery | |
| 2018 | — | — | 16.4% | 37 | Fragile | Recovery | |
| 2017 | — | — | 15.3% | 33 | Critical Intervention Needed | Recovery | |
| 2016 | — | — | 15.7% | 29 | Critical Intervention Needed | Decline Risk | |
| 2015 | — | — | 13.9% | 33 | Critical Intervention Needed | Decline Risk | |
| 2014 | — | — | 13.6% | 41 | Financially Distressed | Decline Risk | |
| 2013 | — | — | 16.9% | 34 | Critical Intervention Needed | Decline Risk | |
| 2012 | — | — | 12.6% | 45 | Fragile | Stable Watch | |
| 2011 | — | — | 14.4% | 45 | Fragile | Stable Watch |
Officer compensation history
Tax year 2025
| Name | Title | Phone | Compensation | |
|---|---|---|---|---|
| JENNIFER WEST | EXECUTIVE DI | 12.8% of Rev | ||
| MARCIA DAVIES | Board Member | — | ||
| RICK DAVIS | Board President | — | ||
| SARA DAVIS | Board President | — | ||
| ROANNE GORDON | Board Member | — | ||
| MARCIA HOLLIFIELD | Board Member | — | ||
| MITCH HYDE | Board Member | — | ||
| KARLA JONES | Board Member | — | ||
| KAREN MICKLER | VICE PRESIDE | — | ||
| JULIE NELMS | Board Member | — | ||
| CHRISTY NORCROSS | Secretary | — | ||
| BILL PRATHER | Board Member | — |
Tax year 2023
| Name | Title | Phone | Compensation | |
|---|---|---|---|---|
| JENNIFER WEST | EXECUTIVE DI | 10.2% of Rev | ||
| KAREN MICKLER | VICE PRESIDE | — | ||
| JULIE NELMS | Board Member | — | ||
| CHRISTY NORCROSS | Secretary | — | ||
| BILL PRATHER | Board Member | — | ||
| ROGER SMOKER | Board Member | — | ||
| DAVID SUMNER | Board Member | — | ||
| MARCIA DAVIES | Board Member | — | ||
| RICK DAVIS | Board President | — | ||
| SARA DAVIS | Board President | — | ||
| ANNE ECK | Board Member | — | ||
| BETH FIELDS | Board Member | — | ||
| ROANNE GORDON | Board Member | — | ||
| MARCIA HOLLIFIELD | Board Member | — | ||
| MITCH HYDE | Board Member | — |
Tax year 2022
| Name | Title | Phone | Compensation | |
|---|---|---|---|---|
| JENNIFER WEST | EXECUTIVE DI | 5.9% of Rev | ||
| MARCIA DAVIES | Board Member | — | ||
| RICK DAVIS | Board President | — | ||
| SARA DAVIS | Board President | — | ||
| ANNE ECK | Board Member | — | ||
| BETH FIELDS | Board Member | — | ||
| ROANNE GORDON | Board Member | — | ||
| MARCIA HOLLIFIELD | Board Member | — | ||
| KAREN MICKLER | VICE PRESIDE | — | ||
| JULIE NELMS | Board Member | — | ||
| CHRISTY NORCROSS | Treasurer | — | ||
| BILL PRATHER | Board Member | — | ||
| ROGER SMOKER | Board Member | — | ||
| DAVID SUMNER | Board Member | — |
Tax year 2021
| Name | Title | Phone | Compensation | |
|---|---|---|---|---|
| BETH FIELDS | EXECUTIVE DI | 9.0% of Rev | ||
| BETTY CLAXTON | Board Member | — | ||
| MARCIA DAVIES | Board Member | — | ||
| RICK DAVIS | Board President | — | ||
| SARA DAVIS | Board President | — | ||
| MARCIA HOLLIFIELD | Board Member | — | ||
| BILL PRATHER | Board Member | — | ||
| ROGER SMOKER | Board Member | — | ||
| KAREN MICKLER | VICE PRESIDE | — | ||
| CHRISTY NORCROSS | Treasurer | — |
Score breakdown
The three components combine into a single 0–100 score weighted as shown. Full methodology →
Peer comparison
Compared to 144 other orgs in NC with NTEE prefix A2.
Most-divergent component: financial score sits 57 points below the peer median (10 vs. 67).
5-year trend: Structural Deficit
Persistently low financial health over 5 years despite strong programmatic output. They are borrowing from their future (or bleeding an endowment) to pay for today's programs.
What's driving this score
- Comp-to-revenue ratio of 12.6% sits within the sector's healthy band (18–22%).
- Financial resilience score in the bottom quartile — reserves and liabilities ratios warrant review.
What would change this score
The two changes that would most improve this score:
- Build cash reserves to at least 3 months of operating expenses — moves financial resilience score meaningfully (~10 points).
Improving governance is a board decision. These are the levers.