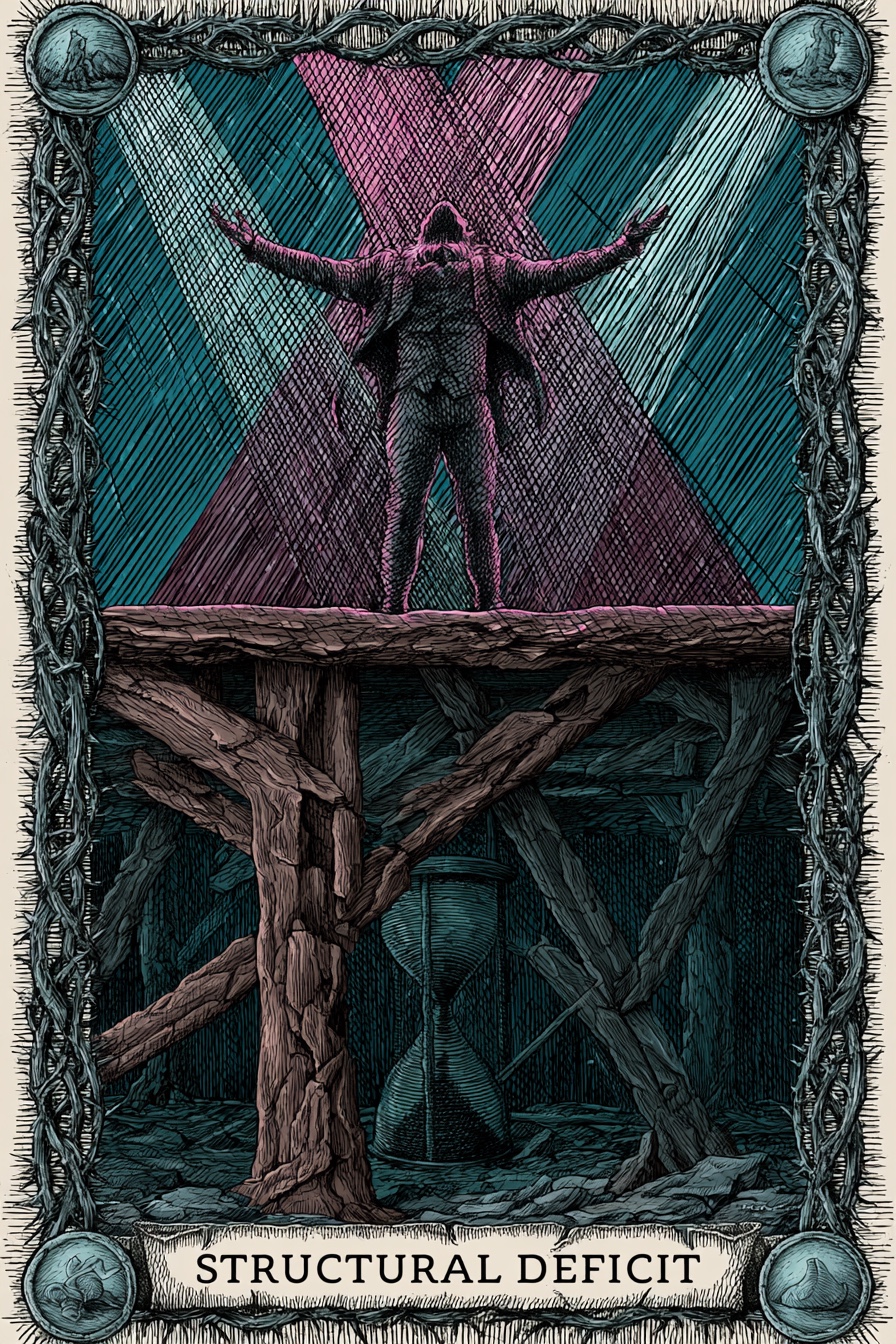
Structural Deficit
What does this mean?
Persistently low financial health over 5 years despite strong programmatic output. They are borrowing from their future (or bleeding an endowment) to pay for today's programs.
The Path Forward
The Truth-Teller
Forces necessary, painful cuts to preserve the core. It demands that the organization stop borrowing from its future and align its current programmatic output with actual sustainable revenue.


Title
Representative Institutions
Institutional Epochs
Historical Performance
| Year | Revenue | Top Comp | Comp % Rev | Score | Phase Label | Outlook | Details |
|---|---|---|---|---|---|---|---|
| 2024 | Hidden | Hidden | 9.1% | 36 | Financially Distressed | Recovery | |
| 2023 | — | — | 10.6% | 32 | Critical Intervention Needed | Decline Risk | |
| 2022 | — | — | 10.0% | 38 | Financially Distressed | Recovery | |
| 2021 | — | — | 10.2% | 34 | Critical Intervention Needed | Recovery | |
| 2020 | — | — | 10.7% | 32 | Critical Intervention Needed | Stable Watch | |
| 2019 | — | — | 12.2% | 32 | Critical Intervention Needed | Decline Risk | |
| 2018 | — | — | 12.6% | 34 | Critical Intervention Needed | Recovery | |
| 2017 | — | — | 13.9% | 32 | Critical Intervention Needed | Decline Risk | |
| 2016 | — | — | 12.8% | 32 | Critical Intervention Needed | Decline Risk | |
| 2015 | — | — | 11.8% | 32 | Critical Intervention Needed | Decline Risk | |
| 2014 | — | — | 12.5% | 34 | Critical Intervention Needed | Stable Watch | |
| 2013 | — | — | 12.7% | 34 | Critical Intervention Needed | Recovery | |
| 2012 | — | — | 12.8% | 32 | Critical Intervention Needed | Stable Watch | |
| 2011 | — | — | — | 32 | Critical Intervention Needed | Stable Watch |
Officer compensation history
Tax year 2023
| Name | Title | Phone | Compensation | |
|---|---|---|---|---|
| LINDA S SULLIVAN | Executive Director | 7.9% of Rev | ||
| SCOTT CRYER | CHAIRMAN | — | ||
| AMY GINN | Treasurer | — | ||
| JULIE D CARTER | Board President | — | ||
| UPEN PATEL | Secretary | — | ||
| JOSE BANZON | Board Member | — | ||
| SUZANNE H BISSELL | Board Member | — | ||
| SKIP CHAPLES | Board Member | — | ||
| BILL DUBOSE | Board Member | — | ||
| EILEEN FILLER-CORN | Board Member | — | ||
| PEGGY FOX | Board Member | — | ||
| LEILA GORDON | Board Member | — | ||
| MICHELE HAZEL | Board Member | — | ||
| SUNG BIN IM | Board Member | — | ||
| DEIRDRE M JOHNSON | Board Member | — | ||
| MICHAEL S LIBERMAN | Board Member | — | ||
| PAT MACINTYRE | Board Member | — | ||
| TIM SARGEANT | Board Member | — | ||
| SEAN SHARIFI | Board Member | — | ||
| CATHERINE SMITTY SMITH | Board Member | — | ||
| DR MAURICE MO B SPRINGER | Board Member | — | ||
| LYNN TADLOCK | Board Member | — | ||
| DOUGLAS J SANDERSON | LEGAL COUNSEL | — |
Tax year 2021
| Name | Title | Phone | Compensation | |
|---|---|---|---|---|
| LINDA S SULLIVAN | Executive Director | 7.7% of Rev | ||
| SHELLY HAZEL | CHAIRWOMAN | — | ||
| PAT MCINTYRE | Treasurer | — | ||
| JENNIFER C OWEN | Treasurer | — | ||
| TIM SARGEANT | Board President | — | ||
| JOSE BANZON | Board Member | — | ||
| SUZANNE BISSELL | Board Member | — | ||
| MICHAEL P COOGAN | Board Member | — | ||
| SCOTT CRYER | Board Member | — | ||
| BILL DUBOSE | Board Member | — | ||
| EILEEN FILLER-CORN | Board Member | — | ||
| LEILA GORDON | Board Member | — | ||
| F RUSSELL HINES | Board Member | — | ||
| MICHAEL S LIEBERMAN | Board Member | — | ||
| MICHAEL FOREHAND | Board Member | — | ||
| CATHERINE SMITH | Board Member | — | ||
| DANDRE WILLIS | Board Member | — | ||
| DEIRDRE M JOHNSON | Board Member | — | ||
| DR MAURICE MO B SPRINGER | Board Member | — |
Score breakdown
The three components combine into a single 0–100 score weighted as shown. Full methodology →
Peer comparison
Compared to 243 other orgs in VA with NTEE prefix A6.
Most-divergent component: financial score sits 48 points below the peer median (5 vs. 53).
5-year trend: Structural Deficit
Persistently low financial health over 5 years despite strong programmatic output. They are borrowing from their future (or bleeding an endowment) to pay for today's programs.
Overall score has gone from 32 → 36 over 5 years (improving by 4 points).
What's driving this score
- Comp-to-revenue ratio of 9.1% sits within the sector's healthy band (18–22%).
- Financial resilience score in the bottom quartile — reserves and liabilities ratios warrant review.
What would change this score
The two changes that would most improve this score:
- Build cash reserves to at least 3 months of operating expenses — moves financial resilience score meaningfully (~10 points).
Improving governance is a board decision. These are the levers.