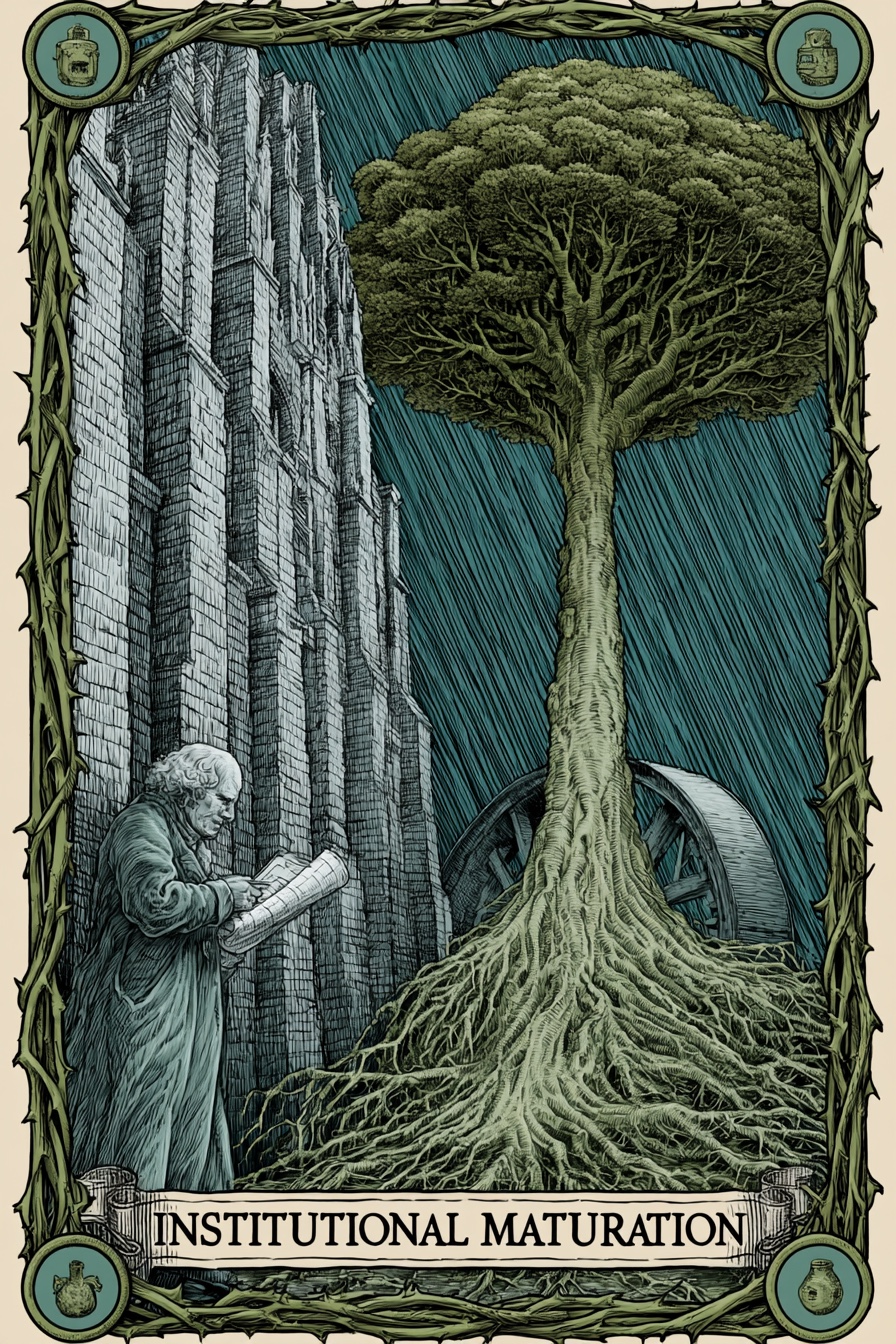
Institutional Maturation
"A comprehensive multi-disciplinary arts center offering education, performance, and exhibition, uniquely providing the area's only art-based afterschool program and extensive outreach to underserved Title One schools."
— Statement of Program Service Accomplishments
What does this mean?
The gold standard. 10-year slow, steady, concurrent growth across Financial Health, Governance, and Program. Leadership is scaling their oversight and impact in lockstep.
The Path Forward
The Crown
A mandate to lead the sector. It encourages the organization to mentor emerging nonprofits and embark on generational capital projects, leveraging their profound stability.
Demonstrated Impact
- 6 teaching artists per school year
- maximum of 65 young artists in grades K-5
- 7 full time scholarships
- 1800 youth
- 4 Title One schools
- 10 arts integration residencies
- over 1200 underserved children
- 18 teachers and teaching artists
- 2 galleries
- hundreds of visitors
Title
Representative Institutions
Institutional Epochs
Historical Performance
| Year | Revenue | Top Comp | Comp % Rev | Score | Phase Label | Outlook | Details |
|---|---|---|---|---|---|---|---|
| 2024 | Hidden | Hidden | — | — | Unknown | — | |
| 2023 | — | — | 4.3% | 49 | Fragile | Stable Watch | |
| 2022 | Hidden | Hidden | 4.3% | 49 | Fragile | Decline Risk | |
| 2021 | — | — | 5.4% | 52 | Fragile | Recovery | |
| 2020 | — | — | 8.7% | 50 | Fragile | Recovery | |
| 2019 | — | — | 2.7% | 47 | Fragile | Recovery | |
| 2018 | — | — | 5.2% | 34 | Critical Intervention Needed | Stable Watch | |
| 2017 | — | — | 5.9% | 34 | Critical Intervention Needed | Stable Watch | |
| 2016 | — | — | 5.1% | 34 | Critical Intervention Needed | Decline Risk | |
| 2015 | — | — | 4.0% | 35 | Financially Distressed | Stable Watch | |
| 2014 | — | — | 3.6% | 35 | Financially Distressed | Stable Watch | |
| 2013 | — | — | 4.3% | 35 | Financially Distressed | Stable Watch | |
| 2012 | — | — | 0.8% | 35 | Financially Distressed | Stable Watch | |
| 2011 | — | — | 4.6% | 35 | Financially Distressed | Stable Watch |
Officer compensation history
Tax year 2025
| Name | Title | Phone | Compensation | |
|---|---|---|---|---|
| WENDY SMITH | Executive Director | 3.8% of Rev | ||
| JACKIE TANNER | Board President | — | ||
| BECKY WOODRUFF | Board Member | — | ||
| HATHAWAY PENDERGRASS | Treasurer | — | ||
| ELLEN MEDEARIS | Board Member | — | ||
| MICHELLE BOLAS | Board Member | — | ||
| RIZA JENKINS | Board Member | — | ||
| EMILY EVENS | Secretary | — | ||
| KAMAL JAMES | Board Member | — | ||
| HELEN KALISHER | Board Member | — | ||
| REBECCA MOORE | Board Member | — | ||
| JOHANNA FOSTER | Board President | — | ||
| MARK KLEINSCHMIDT | Board Member | — | ||
| BERNADETTE PELISSIER | Board Member | — |
Tax year 2021
| Name | Title | Phone | Compensation | |
|---|---|---|---|---|
| Daniel Mayer | Executive Director | 3.7% of Rev | ||
| Daniel Mayer | Executive Director | 3.5% of Rev | ||
| Jean Hamilton | Board Member | — | ||
| Ellen Medearis | Board Member | — | ||
| Mary Carter Taub | Board Member | — | ||
| Michael Parker | Board Member | — | ||
| Hathaway Pendergrass | Board Member | — | ||
| Jackie Tanner | Board Member | — | ||
| Michael Frisch | Board President | — | ||
| Bernadette Pelissier | Board President | — | ||
| Arthur Bolick | Secretary | — | ||
| Charlotte Walton | Treasurer | — | ||
| Bruce Runberg | Board Member | — | ||
| Jean Hamilton | Board Member | — | ||
| Ellen Medearis | Board Member | — | ||
| Mary Carter Taub | Board Member | — | ||
| Michael Parker | Board Member | — | ||
| Hathaway Pendergrass | Board Member | — | ||
| Jackie Tanner | Board Member | — | ||
| Johanna Foster | Board Member | — | ||
| Wendy Smith | Board Member | — | ||
| Keta Barnes | Board Member | — | ||
| Michael Frisch | Board President | — | ||
| Bernadette Pelissier | Board President | — | ||
| Arthur Bolick | Secretary | — | ||
| Charlotte Walton | Treasurer | — | ||
| Dan Krebill | Board Member | — | ||
| Bruce Runberg | Board Member | — |
Score breakdown
The three components combine into a single 0–100 score weighted as shown. Full methodology →
Peer comparison
Compared to 144 other orgs in NC with NTEE prefix A2.
Most-divergent component: financial score sits 32 points below the peer median (35 vs. 67).
5-year trend: Institutional Maturation
The gold standard. 10-year slow, steady, concurrent growth across Financial Health, Governance, and Program. Leadership is scaling their oversight and impact in lockstep.
What's driving this score
- Comp-to-revenue ratio of 4.3% sits within the sector's healthy band (18–22%).
What would change this score
The two changes that would most improve this score:
- Build cash reserves to at least 3 months of operating expenses — moves financial resilience score meaningfully (~10 points).
Improving governance is a board decision. These are the levers.