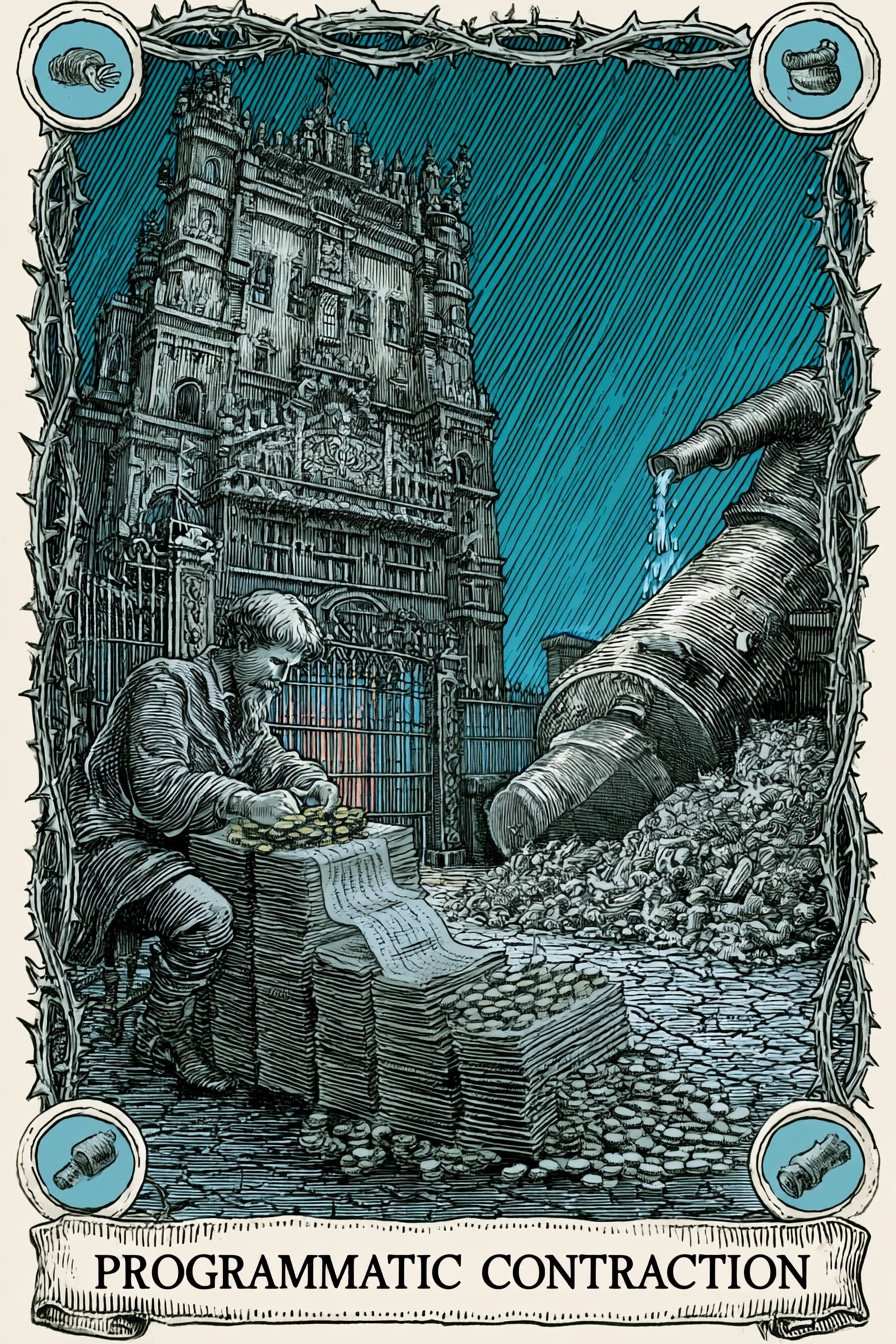
Programmatic Contraction
What does this mean?
Total revenue is stable, but the percentage of expenses spent on actual mission shrinks. Indicates administrative bloat and spending on the machinery of raising money rather than the art itself.
The Path Forward
The Rainmaker
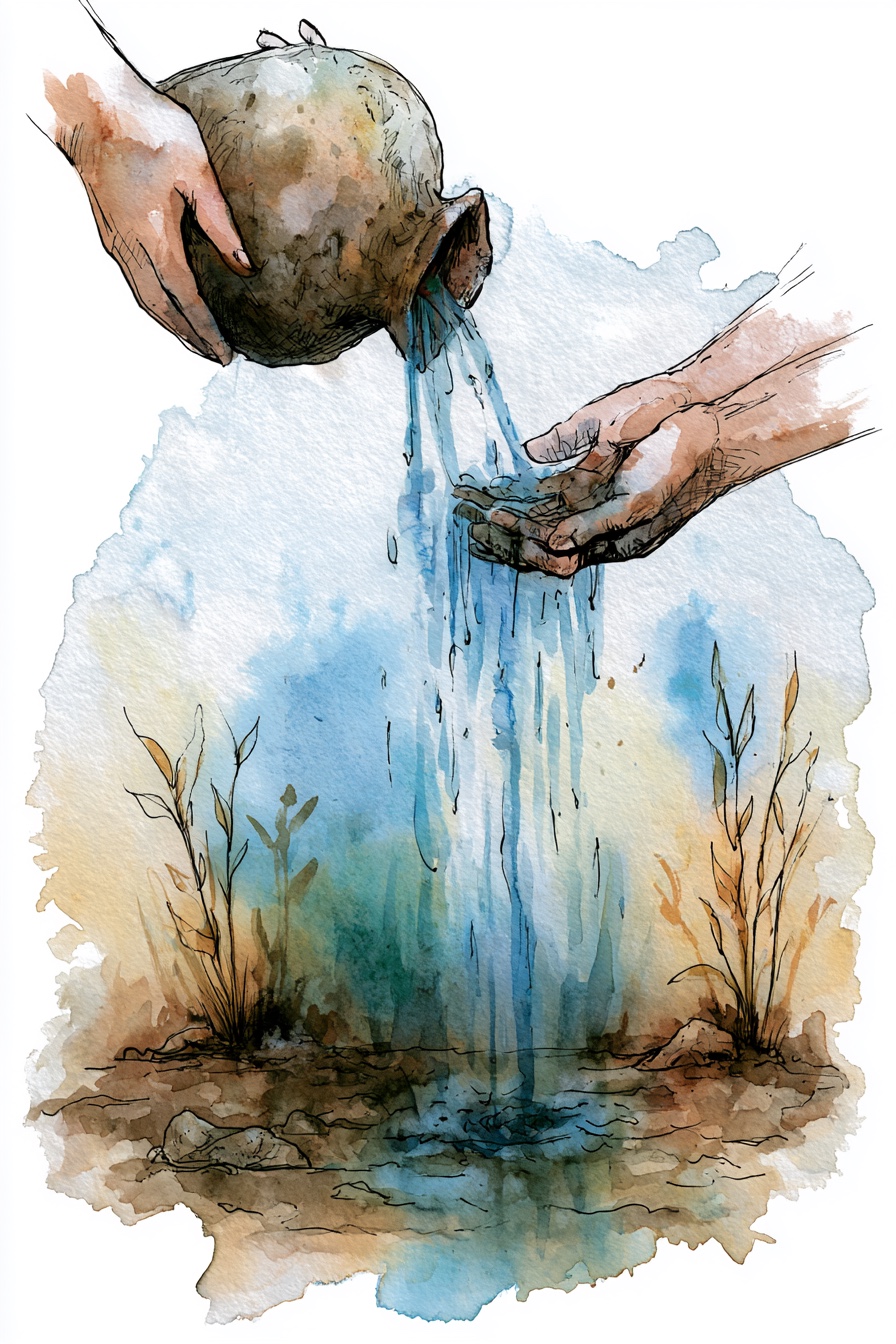
Represents the forced release of hoarded resources back into the community. It acts as a pressure valve against administrative capture, ensuring the mission takes priority over the machine.
Title
Representative Institutions
Institutional Epochs
Historical Performance
| Year | Revenue | Top Comp | Comp % Rev | Score | Phase Label | Outlook | Details |
|---|---|---|---|---|---|---|---|
| 2022 | — | — | 15.3% | 34 | Critical Intervention Needed | Gov Risk | |
| 2021 | — | — | 30.9% | 20 | Critical Intervention Needed | Gov Risk | |
| 2020 | — | — | 15.8% | 27 | Critical Intervention Needed | Decline Risk | |
| 2019 | — | — | 25.8% | 19 | Critical Intervention Needed | Gov Risk | |
| 2018 | — | — | 26.4% | 31 | Critical Intervention Needed | Gov Risk | |
| 2017 | — | — | 24.9% | 26 | Critical Intervention Needed | Gov Risk | |
| 2016 | — | — | 24.6% | 26 | Critical Intervention Needed | Gov Risk | |
| 2015 | — | — | 16.4% | 40 | Fragile | Recovery | |
| 2014 | — | — | 17.7% | 37 | Fragile | Stable Watch | |
| 2013 | — | — | 12.3% | 39 | Fragile | Stable Watch |
Officer compensation history
Tax year 2022
| Name | Title | Phone | Compensation | |
|---|---|---|---|---|
| FRANCOIS PERRON | Board Member | 62.2% of Rev | ||
| RAEMAN KILFOIL | Treasurer | — | ||
| BRIAN GUGGIANA | Secretary | — | ||
| MOHAMMAD ULLAH | Board President | — |
Tax year 2021
| Name | Title | Phone | Compensation | |
|---|---|---|---|---|
| FRANCOIS PERRON | Board President | 113.9% of Rev | ||
| JUSTIN DAVIS | Secretary | — | ||
| LAWRENCE SCHILLER | Treasurer | — |
Score breakdown
The three components combine into a single 0–100 score weighted as shown. Full methodology →
Peer comparison
Compared to 1,226 other orgs in NY with NTEE prefix A6.
Most-divergent component: program score sits 24 points below the peer median (5 vs. 29).
5-year trend: Programmatic Contraction
Total revenue is stable, but the percentage of expenses spent on actual mission shrinks. Indicates administrative bloat and spending on the machinery of raising money rather than the art itself.
Overall score has gone from 31 → 34 over 5 years (improving by 3 points).
What's driving this score
- Comp-to-revenue ratio of 15.3% sits within the sector's healthy band (18–22%).
What would change this score
The two changes that would most improve this score:
- Separate signing authority from fundraising authority when both are held by one person — removes the concentration penalty (~12 points).
Improving governance is a board decision. These are the levers.