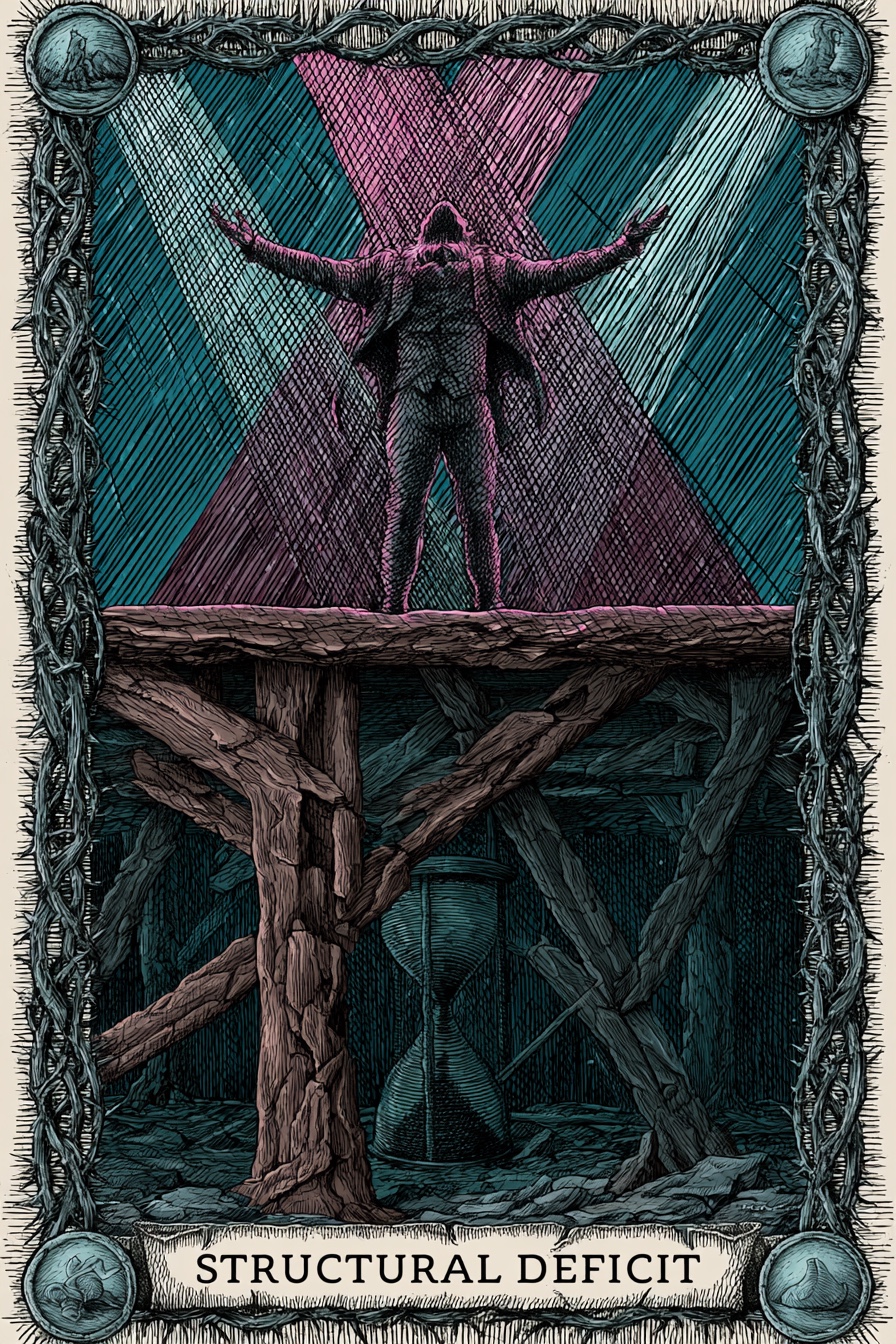
Structural Deficit
"Enriches and educates Upper Midwest audiences and schools with exceptional live theatre, with a strong focus on diverse youth (especially BIPOC and low-income students) through extensive educational programming and inclusive casting, projecting to serve over 70,000 youth annually post-merger."
— Statement of Program Service Accomplishments
What does this mean?
Persistently low financial health over 5 years despite strong programmatic output. They are borrowing from their future (or bleeding an endowment) to pay for today's programs.
The Path Forward
The Truth-Teller
Forces necessary, painful cuts to preserve the core. It demands that the organization stop borrowing from its future and align its current programmatic output with actual sustainable revenue.
Demonstrated Impact
- Typically serves an audience of approximately 25,000 teens annually
- 1 in every 15 Minnesota 7-12 grade students
- Over 33% are students of color
- Cast classics like Shakespeare productions with 30-60% artists of color
- Youth audience is typically 55% students who self-identify as BIPOC
- Over 50% qualify for free and reduced lunch
- In the summer of 2021, 80% of the participants were from St. Paul and its suburbs, and 20% lived outside the Twin Cities
- Serving 781 young artists in 2022
- Projected 70,000+ youth attending performances and participating in educational activities (after merger)
- Population served represents the many Minnesota populations: 1% American Indian, 5% Asian, 10% Black, 5% Hispanic/Latino, and 79% White.
Title
Representative Institutions
Institutional Epochs
Historical Performance
| Year | Revenue | Top Comp | Comp % Rev | Score | Phase Label | Outlook | Details |
|---|---|---|---|---|---|---|---|
| 2025 | Hidden | Hidden | — | — | Unknown | — | |
| 2023 | Hidden | Hidden | 1.4% | 35 | Financially Distressed | Stable Watch | |
| 2022 | — | — | 2.2% | 35 | Financially Distressed | Stable Watch | |
| 2021 | — | — | 1.9% | 35 | Financially Distressed | Stable Watch | |
| 2020 | — | — | 0.6% | 35 | Financially Distressed | Decline Risk | |
| 2019 | — | — | 6.9% | 34 | Critical Intervention Needed | Decline Risk | |
| 2018 | — | — | 8.1% | 34 | Critical Intervention Needed | Decline Risk | |
| 2017 | — | — | 7.4% | 34 | Critical Intervention Needed | Decline Risk | |
| 2016 | — | — | 8.3% | 48 | Fragile | Decline Risk | |
| 2015 | — | — | 6.8% | 52 | Fragile | Recovery | |
| 2014 | — | — | 8.0% | 50 | Fragile | Recovery | |
| 2013 | — | — | 8.0% | 40 | Financially Distressed | Decline Risk | |
| 2012 | — | — | 6.4% | 34 | Critical Intervention Needed | Decline Risk | |
| 2011 | — | — | 5.5% | 42 | Fragile | Stable Watch |
Officer compensation history
Tax year 2026
| Name | Title | Phone | Compensation | |
|---|---|---|---|---|
| STEPHEN DIMENNA | Artistic Director | 5.2% of Rev | ||
| MARK HOWLETT | Board President | — | ||
| PONDIE TAYLOR | Board President | — | ||
| GREG ROBINSON | Treasurer | — | ||
| CLAIRE REPP | Secretary | — | ||
| SUNNY BEDDOW | Board Member | — | ||
| CATHERINE CRAFT-FAIRCHILD | Board Member | — | ||
| MARK GRAVES | Board Member | — | ||
| AMBER HOLLO | Board Member | — | ||
| LUANNE PEDERSON | Board Member | — | ||
| SUSAN ROSTKOSKI | Board Member | — | ||
| PAUL STEMBLER | Board Member | — |
Tax year 2023
| Name | Title | Phone | Compensation | |
|---|---|---|---|---|
| MARK FERRARO-HAUCK | Executive Director | 1.8% of Rev | ||
| PAUL R SACKETT | Board President | — | ||
| SUSAN ROSTKOSKI | Board President | — | ||
| ANDREA TRIMBLE HART | Treasurer | — | ||
| PAUL F CASEY | Secretary | — | ||
| PAUL MATTESSICH | Board President | — | ||
| KRISTIN BERGER PARKER | Board Member | — | ||
| NANCY FELDMAN | Board Member | — | ||
| JEWELIE GRAPE | Board Member | — | ||
| PAUL JOHNSON | Treasurer | — | ||
| PAUL STEMBLER | Board Member | — | ||
| MARK HOWLETT | Board Member | — |
Tax year 2022
| Name | Title | Phone | Compensation | |
|---|---|---|---|---|
| MARK FERRARO-HAUCK | Executive Director | 0.6% of Rev | ||
| PAUL R SACKETT | Board President | — | ||
| SUSAN ROSTKOSKI | Board President | — | ||
| ANDREA TRIMBLE HART | Treasurer | — | ||
| PAUL F CASEY | Secretary | — | ||
| PAUL MATTESSICH | Board President | — | ||
| KRISTIN BERGER PARKER | Board Member | — | ||
| PATRICK BROWN | Board Member | — | ||
| NANCY FELDMAN | Board Member | — | ||
| JEWELIE GRAPE | Board Member | — | ||
| PAUL JOHNSON | Treasurer | — | ||
| GREG LANDMARK | Board Member | — | ||
| JOHN LEFEVRE | Board Member | — | ||
| PAUL STEMBLER | Board Member | — | ||
| GREG SULLIVAN | Board Member | — |
Tax year 2021
| Name | Title | Phone | Compensation | |
|---|---|---|---|---|
| FLORDELINO LAGUNDINO | Artistic Director | 3.9% of Rev | ||
| C MICHAEL-JON PEASE | Executive Director | 3.9% of Rev | ||
| SHERI ZIGAN | Treasurer | 3.7% of Rev | ||
| PAUL MATTESSICH | Board President | — | ||
| JEWELIE GRAPE | Board President | — | ||
| ANDREA TRIMBLE HART | Treasurer | — | ||
| NANCY FELDMAN | Secretary | — | ||
| JOHN BERTHIAUME | Board Member | — | ||
| PATRICK BROWN | Board Member | — | ||
| PAUL F CASEY | Board Member | — | ||
| GISSELL CASTELLON | Board Member | — | ||
| RITA DIBBLE | Board Member | — | ||
| JIM FALTEISEK | Board Member | — | ||
| PATRICIA IZEK | Board Member | — | ||
| PAUL JOHNSON | Board Member | — | ||
| GREG LANDMARK | Board Member | — | ||
| JOHN LEFEVRE | Board Member | — | ||
| KRISTIN BERGER PARKER | Board Member | — | ||
| SHONA RAMCHANDANI | Board Member | — | ||
| SUSAN ROSTKOSKI | Board Member | — | ||
| KARI RUTH | Board Member | — | ||
| PAUL R SACKETT | Board Member | — | ||
| PAUL STEMBLER | Board Member | — | ||
| GREG SULLIVAN | Board Member | — |
Score breakdown
The three components combine into a single 0–100 score weighted as shown. Full methodology →
Peer comparison
Compared to 257 other orgs in MN with NTEE prefix A6.
Most-divergent component: financial score sits 51 points below the peer median (0 vs. 51).
5-year trend: Structural Deficit
Persistently low financial health over 5 years despite strong programmatic output. They are borrowing from their future (or bleeding an endowment) to pay for today's programs.
What's driving this score
- Comp-to-revenue ratio of 1.4% sits within the sector's healthy band (18–22%).
- Financial resilience score in the bottom quartile — reserves and liabilities ratios warrant review.
What would change this score
The two changes that would most improve this score:
- Build cash reserves to at least 3 months of operating expenses — moves financial resilience score meaningfully (~10 points).
Improving governance is a board decision. These are the levers.