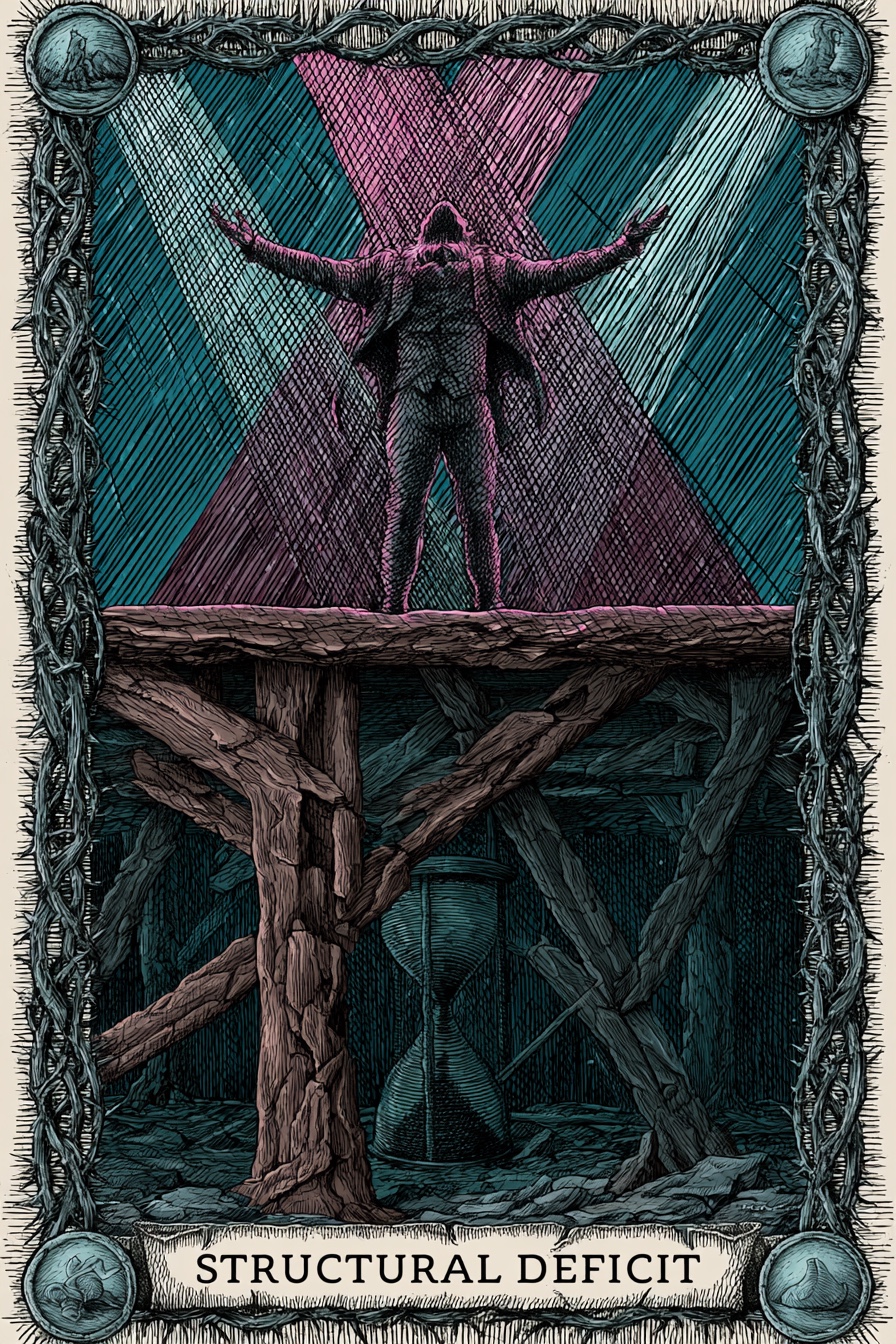
Structural Deficit
Structural Deficit
Structural Deficit Market Archetype Mechanical Natural
Tier
Priority Review
Trajectory Thumbprint

Structural Deficit

What does this mean?

Persistently low financial health over 5 years despite strong programmatic output. They are borrowing from their future (or bleeding an endowment) to pay for today's programs.

The Path Forward

The Truth-Teller

Forces necessary, painful cuts to preserve the core. It demands that the organization stop borrowing from its future and align its current programmatic output with actual sustainable revenue.

The Truth-Teller
The Truth-Teller
Institutional Health Scores
5-yr trend: Structural Deficit
Overall
26
Score
Governance
42
Score
Financial
0
Score
Program
60
Score

Institutional Epochs

2010
2011
2012
2013
2014
2015
2016
2017
2018
2019
2020
2021
2022
2023
2024
Financial Era
Governance Era
Trajectory Era
Structural Deficit

Historical Performance

Year Revenue Top Comp Comp % Rev Score Phase Label Outlook Details
2023 Hidden Hidden Unknown
2021 25.4% 21 Critical Intervention Needed Gov Risk
2020 41.6% 21 Critical Intervention Needed Stable Watch
2019 36.1% 21 Critical Intervention Needed Gov Risk
2018 40.8% 22 Critical Intervention Needed Decline Risk
2017 8.8% 36 Financially Distressed Recovery
2016 33 Critical Intervention Needed Decline Risk
2015 43 Financially Distressed Recovery
2014 37 Financially Distressed Recovery
2013 21 Critical Intervention Needed Decline Risk
2012 29 Critical Intervention Needed Recovery
2011 25 Critical Intervention Needed Stable Watch

Officer compensation history

Tax year 2022

Name Title Phone Email Compensation
Emily Weiner Board President 12.3% of Rev
Kevin Connor Board Member 7.6% of Rev
Jeffrey Solomom Board Member 1.5% of Rev
Rashad V Chambers Secretary
Jane Dubin Board President
Amy Gutlieb Board President
Melissa Springs Treasurer
R Erin Craig Board Member
Jenny Paredes Board Member
Jeremy Handelman Board Member
Jennifer Isaacson Board Member
Jeffrey Rosenstock Board Member

Tax year 2021

Name Title Phone Email Compensation
Emily Weiner Board President 9.3% of Rev
Kevin Connor Board Member 6.5% of Rev
Jeffrey Solomom Board Member 0.2% of Rev
Rashad V Chambers Secretary
Jane Dubin Board President
Amy Gutlieb Board President
Melissa Springs Treasurer
R Erin Craig Board Member
Jenny Paredes Board Member
Jeremy Handelman Board Member
Jennifer Isaacson Board Member
Jeffrey Rosenstock Board Member
Rashad V Chambers Secretary
Jane Dubin Board President
Amy Gutlieb Board President
Melissa Springs Treasurer
R Erin Craig Board Member
Jenny Paredes Board Member
Jeremy Handelman Board Member
Jennifer Isaacson Board Member
Jeffrey Rosenstock Board Member
Officer contact details, exact compensation figures, and active litigation are available to verified members.
Request access
Score breakdown

Score breakdown

Financial resilience
0 / 100
weight 40%
Governance risk
42 / 100
weight 40%
Program scale
60 / 100
weight 20%
Overall
26 / 100
Priority Review

The three components combine into a single 0–100 score weighted as shown. Full methodology →

Peer comparison

Fewer than 3 peers found in NY for this NTEE subcategory; peer comparison would not be statistically meaningful.

5-year trend: Structural Deficit

Persistently low financial health over 5 years despite strong programmatic output. They are borrowing from their future (or bleeding an endowment) to pay for today's programs.

What's driving this score

What would change this score

The two changes that would most improve this score:

  1. Reduce top-officer compensation from 34.0% to under 22% of revenue — would move governance score by ~24 points.
  2. Separate signing authority from fundraising authority when both are held by one person — removes the concentration penalty (~12 points).

Improving governance is a board decision. These are the levers.