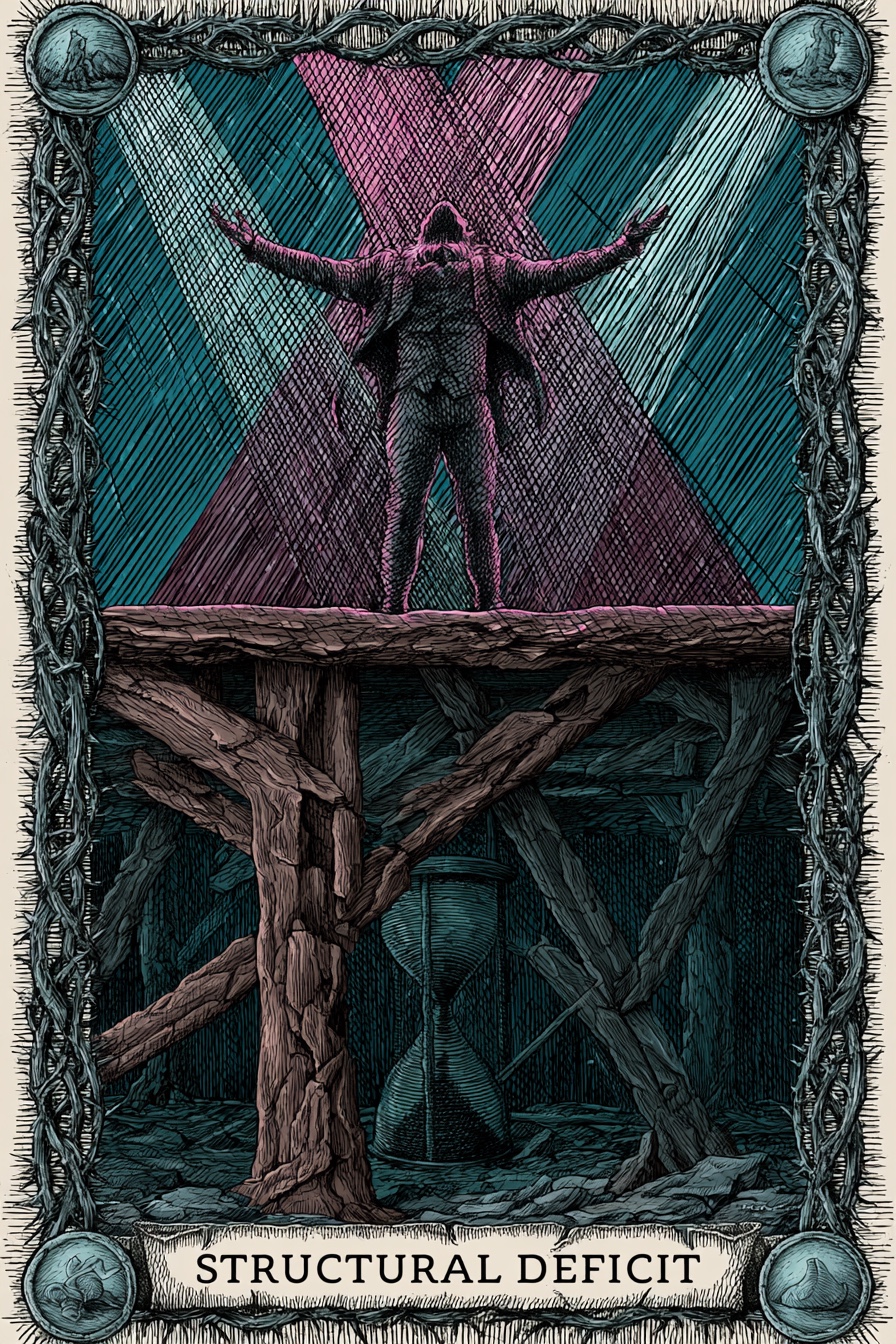
Structural Deficit
What does this mean?
Persistently low financial health over 5 years despite strong programmatic output. They are borrowing from their future (or bleeding an endowment) to pay for today's programs.
The Path Forward
The Truth-Teller
Forces necessary, painful cuts to preserve the core. It demands that the organization stop borrowing from its future and align its current programmatic output with actual sustainable revenue.

Title
Representative Institutions
Institutional Epochs
Historical Performance
| Year | Revenue | Top Comp | Comp % Rev | Score | Phase Label | Outlook | Details |
|---|---|---|---|---|---|---|---|
| 2024 | Hidden | Hidden | — | — | Unknown | — | |
| 2022 | Hidden | Hidden | — | — | Unknown | — | |
| 2021 | Hidden | Hidden | — | — | Unknown | — |
Officer compensation history
No IRS 990 Part VII compensation data available for this organization.
Score breakdown
The three components combine into a single 0–100 score weighted as shown. Full methodology →
Peer comparison
Compared to 450 other orgs in NY with NTEE prefix B8.
Most-divergent component: governance score sits 0 points above the peer median (85 vs. 85).
5-year trend: Structural Deficit
Persistently low financial health over 5 years despite strong programmatic output. They are borrowing from their future (or bleeding an endowment) to pay for today's programs.
What's driving this score
- Comp-to-revenue ratio of 0.0% sits within the sector's healthy band (18–22%).
What would change this score
No specific high-impact levers identified — this org's score is balanced across components.
Improving governance is a board decision. These are the levers.